>December 13th, 2009 · No Comments
After all the decades of software development, and recently hyped trends (e.g. “programming in graphical diagrams”) plain text source code is still the most powerful way to build software systems. Regarding this a high degree of importance is readability and comprehension of source code. In fact you’re spending more time in reading as with writing code. Apart from improving the structure of the code itself (the refactoring concept plays a big role here) syntax highlighting is also very important to get a quick overview. Following gives an example how and why to tweak your editor defaults.
IDE defaults
Defaults from several IDEs or more simple text-editors are already giving big help, e.g. in showing keywords, instance fields or comments. Still in my view they can be tweaked, most of editors give options to extend things. Either they work with a graphical interface for changing settings (IDEs like IntelliJ, Eclipse etc.) or are working themselves with plain text highlighting configuration files (vim, krusader etc.). Your syntax highlighting toolbox contains text-decorations (like italic, underscored, bold) and coloring (foreground, background).
For my tweaks I used my favorite IDE IntelliJ, which offers many syntax highlighting options. Just checkout your editor and see what is possible.
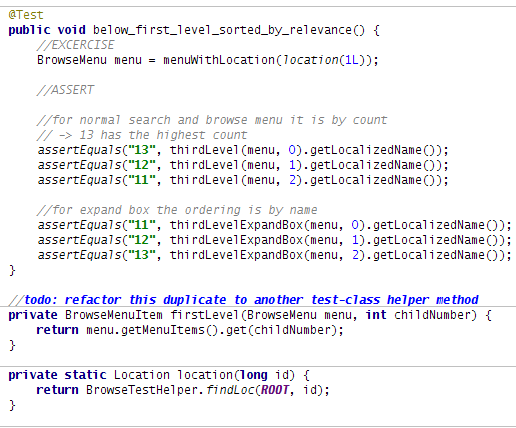
Example BEFORE
Following annoyed me on the default settings:
- Could not instantly see parameters and variables
- No difference between local-vars and parameters
- Non-javadoc comments were too grey. I write comments to explain the ‘Why’ or a important block of a code statement. So comments should be better visible.
- Todo comments were blue. Blue is a too “friendly” color to me, whereas looking at todos should wake me up!
- Instance and static vars were colored the same though they have different semantics.
- I tend to use more smaller methods as one monster method. The default highlighting does not separate between method declarations and calls.
The BEFORE snippet:

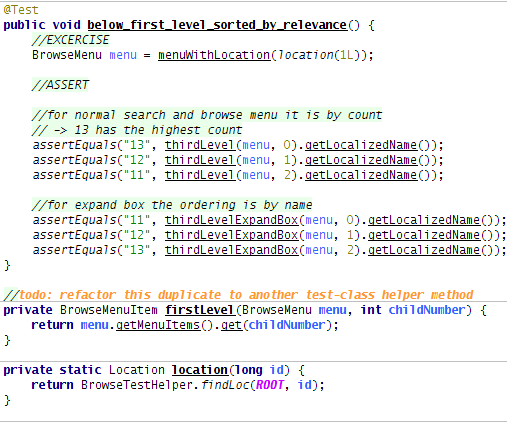
Example AFTER
I changed settings to:
- Non-instance + static variables are blue now. Parameters should be handled with more care. (changing them side-effect the callee), so they are bold.
- Static and instance vars have different colors now (pink vs. violet).
- Comments have slight green background now.
- Todo flags have the signal-color orange
- Methods are underscored. Declarations are bold, calls are non-bold.
The AFTER snippet:

Tags: Uncategorized
>November 21st, 2009 · No Comments
One of firefox killer-features is the variety of add-ons. Following is an overview of the add-ons I use currently.
Vimperator
Vimperator is a real gem! Adds some vim (editor) feeling to the browser. Makes you faster, because nearly all mouse action can be supplemented with keyboard shortcuts. Also automates more complicated flows with macros. At start using vimperator can be somewhat annoying because pressing some keys do unexpected things, but investing time to get used to it pays off definetely.
Xmarks
Xmarks saves your bookmarks to a server and makes synchronization possible between different machines. Very handy if you are working from different computers. Most likely it could be replaced by upcoming firefox 4 which offers this functionality in its core.
Web Developer
Web Developer is a nice webdeveloper testing kit. Numerous things can be done like style/CSS testing, gathering meta-information of the page, handling cookies, finding broken images.
Firebug
Firebug is a perfect accompany to Webdeveloper for testing/analyzing websites. Offers JavaScript debugging, analyzing DOM tree, viewing CSS styleor watching HTTP calls and request/response contents. It is also plugin aware (see below).
Firecookie
Firecookie is an addon for firebug. Makes cookies handling (reading, deleting, editing) much easier as with Webdeveloper plugin.
YSlow
YSlow is an addon for firebug, which offers performance test for webapplications. Gives a good overview how your site performs and gives a summary in grade style (A-F). If it gives you bad grade, still question whether they are appropriate in your special case (e.g. YSlow moans about missing CDNs, but an usage of a CDN doesn’t always makes sense or you don’t have any control over certain included components).
Live HTTP Headers
Firebug offers good HTTP traffic tracking. But sometimes I also use Live HTTP Headers because you can filter tracking HTTP calls by URL and content-type, for HTTP POST you can set your own defined payload.
JSONView
When testing webapps, instead of using curl sometimes it is handy to fire a HTTP request directly through firefox. If doing so by default firefox makes problems and prompts to save json (Content-type: application/json) as a file to instead of just displaying the content inside the browser window. JSONView bypasses this and displays json content appropriately.
Tags: Technologies/Tools
TestNG offers many great features and is definitely more capable as JUnit to build a strong automated Test-Suite. When writing test-cases one important factor is the handling of test-data. With JUnit it is cumbersome to feed different test-data to the same test-code. TestNG solves this much better.
Let’s look at a very simple example. When trying to test an exception with JUnit 4 with different test-data I would need to write something like:
This code has essential problems:
- Because I want to avoid to write two more test-methods (essentialy the same production code is triggered), I am putting three test-cases into one test-method, which is bad practice. This is because test cases aren’t using the tearDown and setUp facilities and cannot guarantee isolation. That is also the reason that I could not use the excpectedException parameter inside the JUnit 4 @Test annotation. Alternative is to really use three test-methods, but code readability then suffers.
- Even though above example is very simplified (only new Foo() is called) the test-code is not expressive. Surely you could improve this by extracting method and giving a good name. But still it is a bit blurry, why we do so and that it is just for using different test-data.
TestNG parameterized test-methods
TestNG does it better and builds the “test-case differs only in test-data” situation into its framework. This is done by building a DataProvider and passing parameters to the test-method. This way code gets more expressive and each different test-data set is executed as an isolated test-case also. Here an example of the TestNG version of above test-cases (I followed the code centric way, you can also configure your DataProvider through an XML file):
class MyTest
{
@DataProvider(name = “wrong_input”)
public Object[][] createData()
{
//2 dimensions
// x: data-set for one test-case
// y: set of parameters (test-method can contain multiple parameters)
return new Object[][]{
{“test-data-1″},
{“test-data-2″},
{“test-data-3″}
};
}
@Test(expectedExceptions = IllegalArgumentException.class,
dataProvider = “wrong_input”)
public void throw_exception_if_bad_input(String input)
{
new Foo(input)
}
}
Tags: Continous Integration · Software Engineering


